Dashboard User Manual
Welcome to the GeoDashboard Help Center. This guide provides comprehensive details on how to navigate the maps, analyze sales telemetry, manage target progress, view MIS reports, and customize your layout.
💡 Quick Tip: Switch between Light and Dark theme in the top header depending on your work environment for optimal readability!
🗺️ 1. Interactive Map Navigation
The map displays geographical boundaries and active sales metrics. It allows you to seamlessly drill down from high-level state boundaries to specific warehouse territories and track individual executive routes.
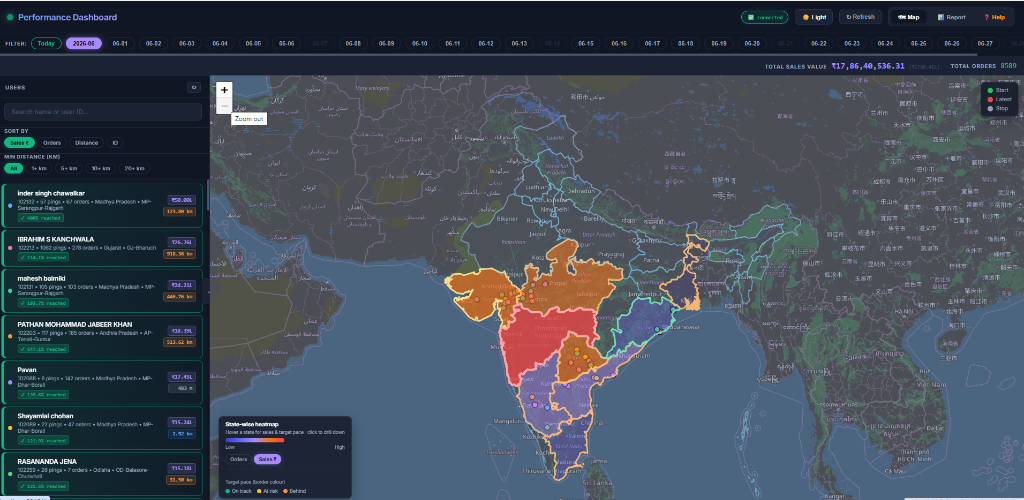
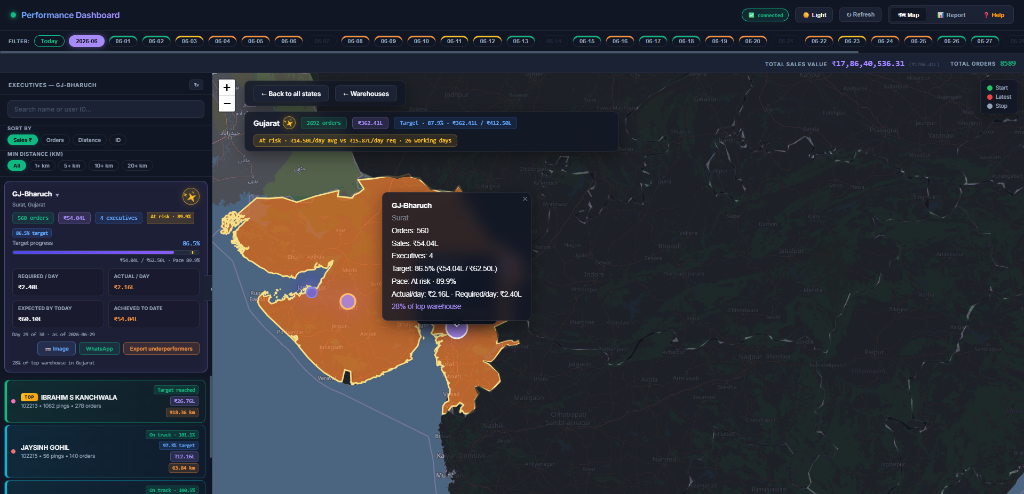
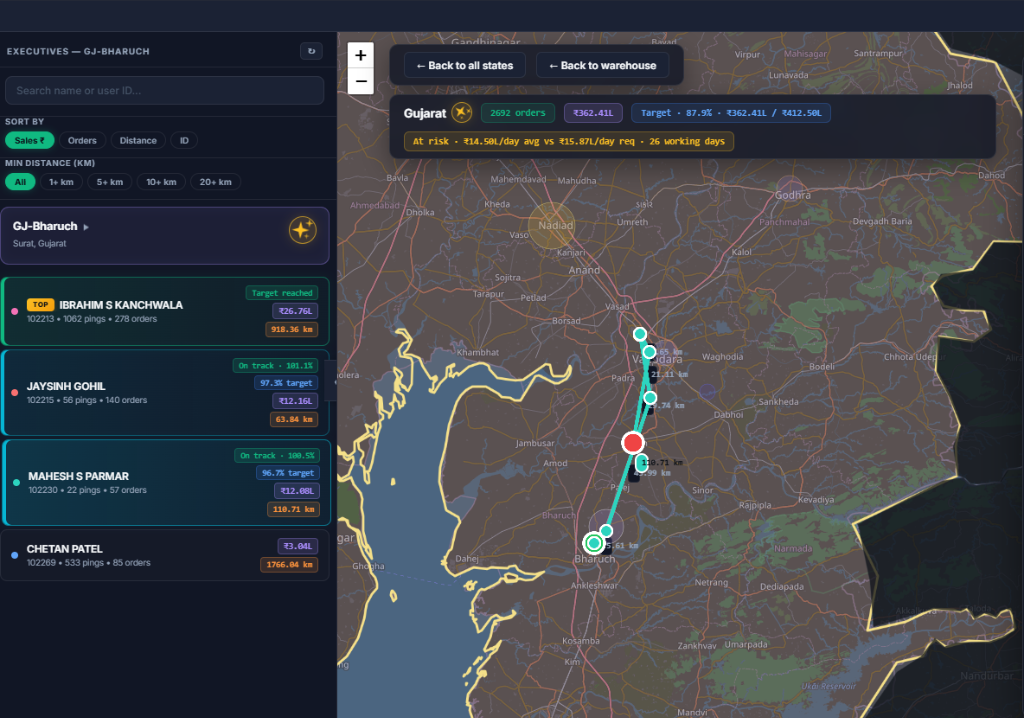
- Zoom Controls: Located at the top left. Click + to zoom in and examine routes, and - to zoom out for state-level views.
- Drill-down States: Click directly on any state boundary on the All India Map to focus on its sales territory.
- Warehouse Pins: Colored circular markers represent warehouses. Clicking on a warehouse zooms in and brings up its detailed sales statistics.
- Executive Routes: When selecting an executive, the map displays their tracked path (glowing green/red dots and path lines) representing their movement.
📊 2. Live Telemetry Details
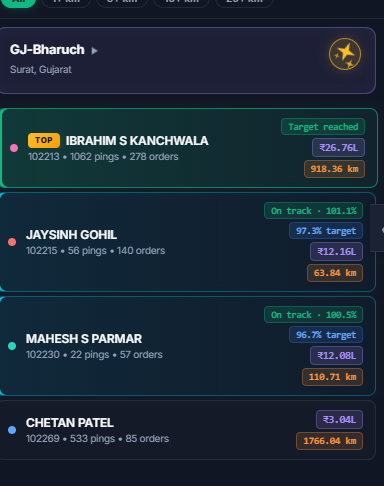
The left sidebar dynamically updates to show target progress, required daily averages, and achievement ratios for the selected warehouse or state.
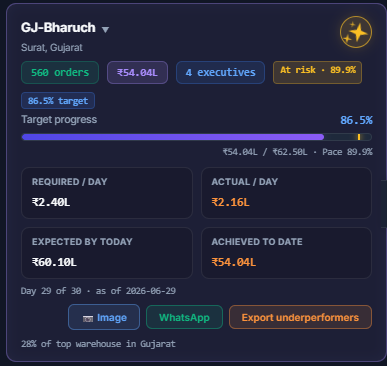
- Required / Day: The sales average required per day to hit the monthly goal.
- Actual / Day: The actual daily sales average achieved. Colored green if on track, orange if behind.
- Achieved to Date: Cumulative sales made during the current period.
- Pace Status Badge: Shows
On Track,At Risk, orBehind Pacebased on performance compared to elapsed time. - Executive List: Lists all executives assigned to the warehouse with their individual pings, orders, distance, and target achievement badges.
👤 3. Performance Report Card
Clicking an executive opens the Performance Report Card. It contains all key metrics, contributions, and incentives.
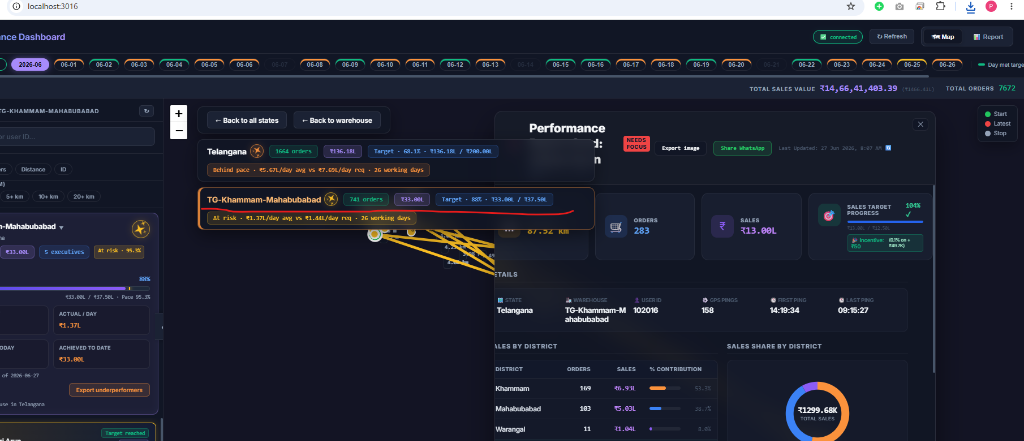
- Target Excess Incentive: If achieved sales exceed the target value, a 0.1% incentive is automatically calculated on the excess amount and displayed.
- District Contribution Chart: An interactive donut chart displaying the percentage of sales contributed by each district under the executive's scope.
- Daily Breakdown Grid: Displays day-wise tracking of distance, orders, and sales in a clean, scroll-free table.
↕️ 4. Resizing & Card Customization
You can adjust the size and location of the Performance Report Card to fit your screen perfectly.
- 8-Directional Resizing: Hover your mouse over any edge or corner of the card to drag and resize it.
- Moving the Card: Click and hold the header of the card to drag it to any part of the screen.
- Auto-snapping: Dragging the card near the bottom-right snaps it back to its default anchored position.
📥 5. Exporting & Sharing
Easily export your reports or share them directly with team members.
- Export Image: Downloads a high-resolution PNG screenshot of the entire report card. The system automatically expands scrollable areas during capture so no data is cut off.
- Share WhatsApp: Formats a summary of the executive's performance metrics and opens WhatsApp Web to share it instantly.
📊 6. MIS Reports & Filtering
The Report tab (MIS view) provides a comprehensive tabular overview of the sales metrics, rankings, and forecasts across all states, warehouses, and executives.
- Top STATS HUD Banners: Displays overall sales value, total order counts, and active date filters.
- Dynamic Filter Bar: Located directly below the MIS sub-tab navigation. It allows you to:
1. **Search**: Search for executives by name or ID.
2. **Filter by State**: Restricts the entire report to a specific state.
3. **Filter by Warehouse**: Restricts the report to a specific warehouse. - MIS Report Sub-Tabs:
- 🗺️ **State Summary**: Aggregated orders and sales values grouped by state.
- 🏢 **Warehouse Summary**: Performance statistics grouped by individual warehouses.
- 🏆 **Executive Ranking**: Rank-ordered list of sales executives based on sales value.
- 📈 **Daily Trend**: Day-wise breakdown of orders and sales values.
- 📅 **WTD Summary**: Week-to-date sales and order performance.
- 🔮 **Forecast**: Predictive sales forecast based on current run-rates.